Analysis Across Datacubes
Causemos supports several types of quantitative analyses across datacubes, including:
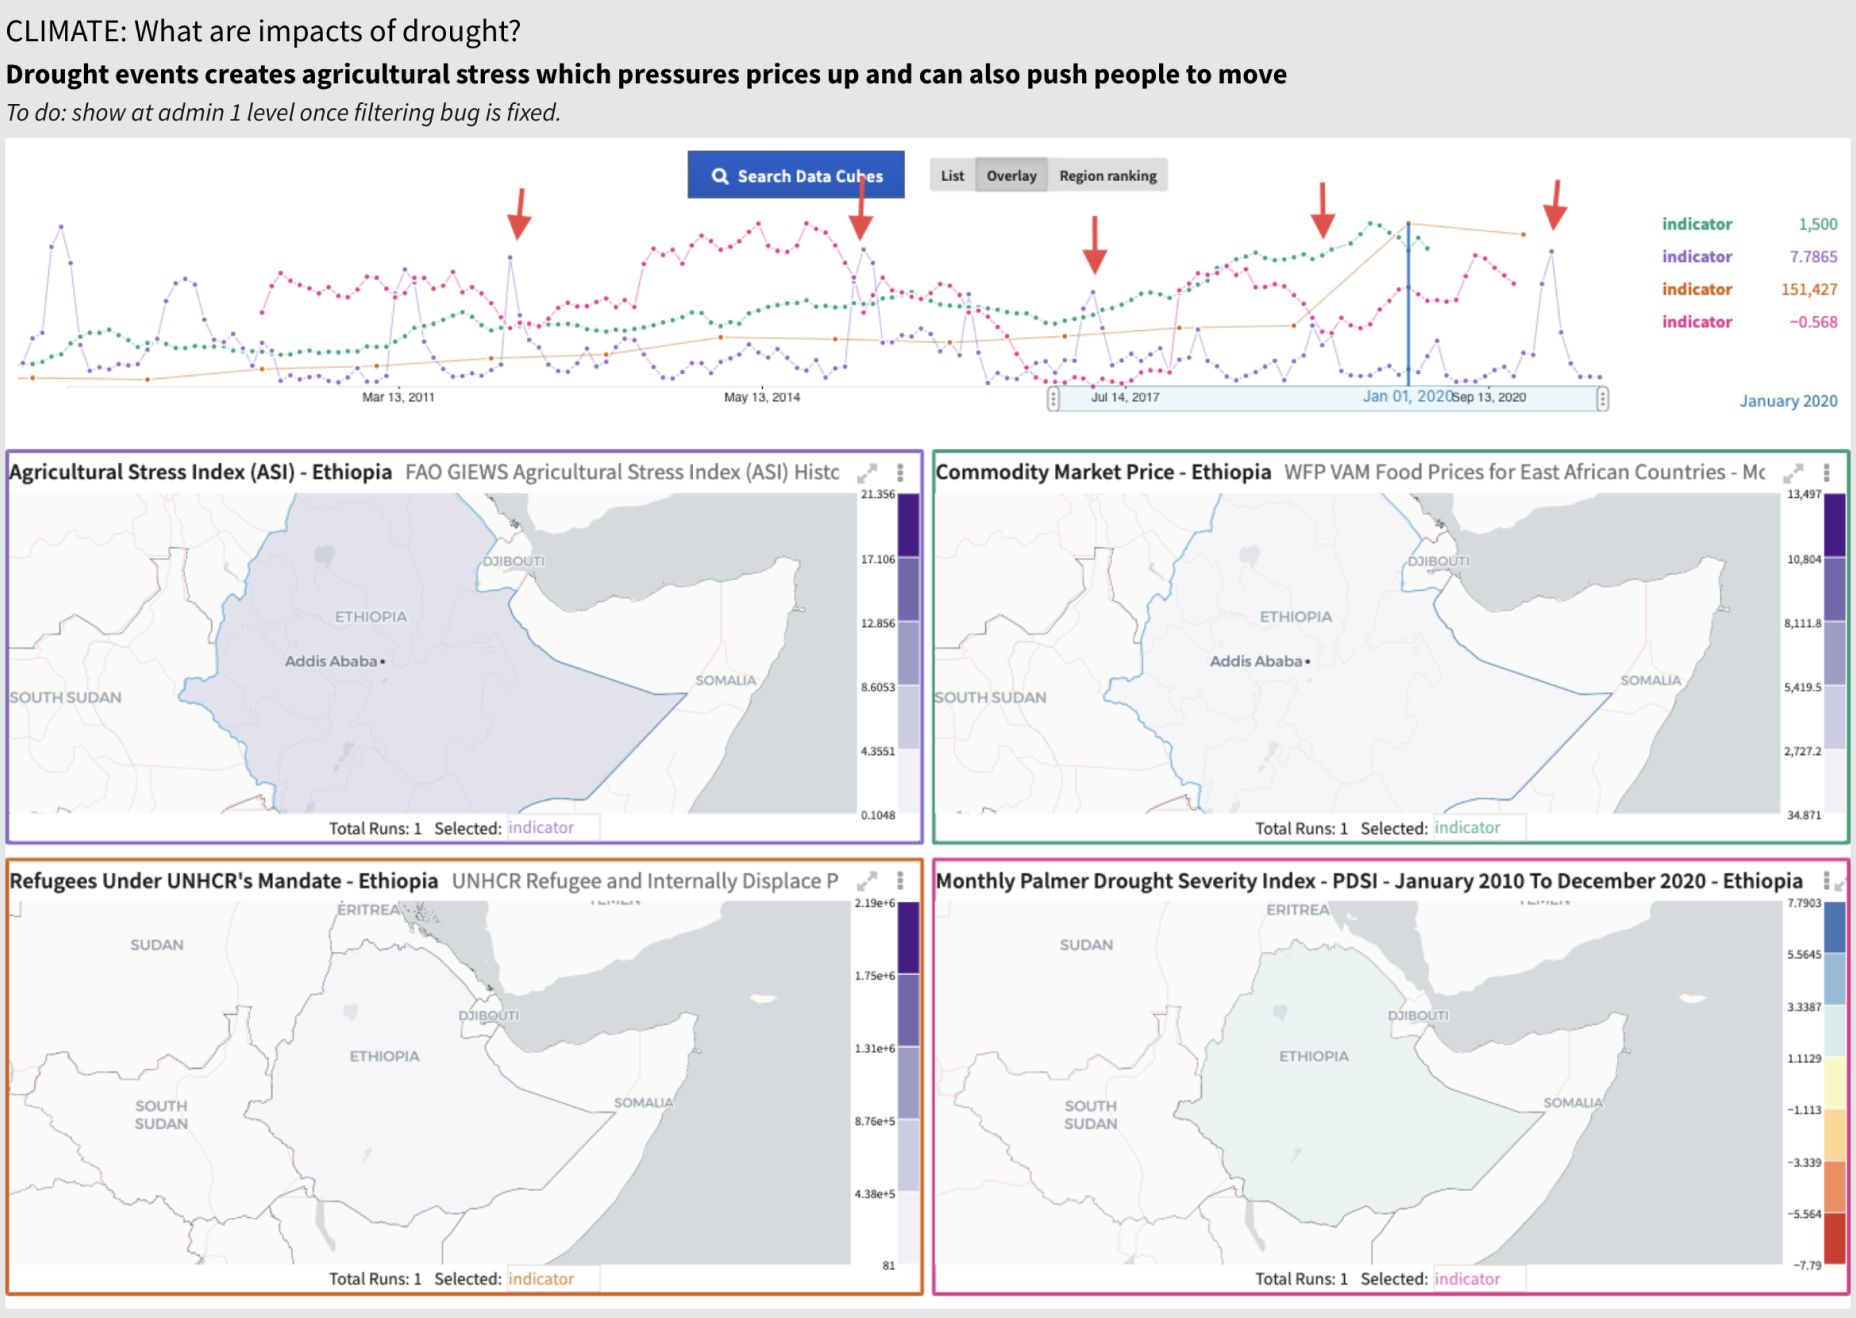
- Overlay - Correlation Among Variables: Determine whether an increase in x usually led to an increase or a decrease in y historically. When indicator x was particularly high/low historically, find the values of other indicators of interest (drivers/impacts).
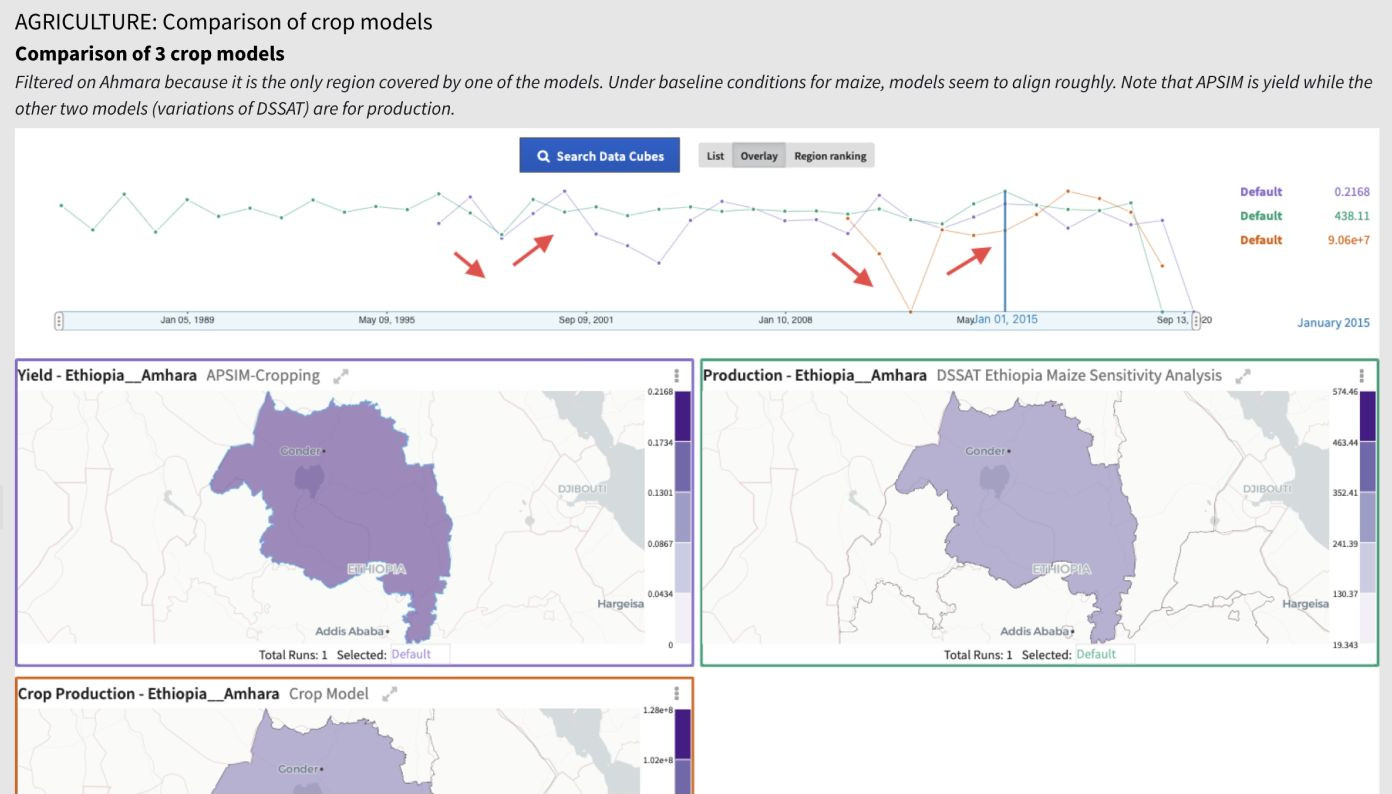
- Overlay - Similar Models/Data Comparison: Determine the similarity of the output of alternative models for comparable scenarios. Determine how similar the data is from different sources for a particular variable.
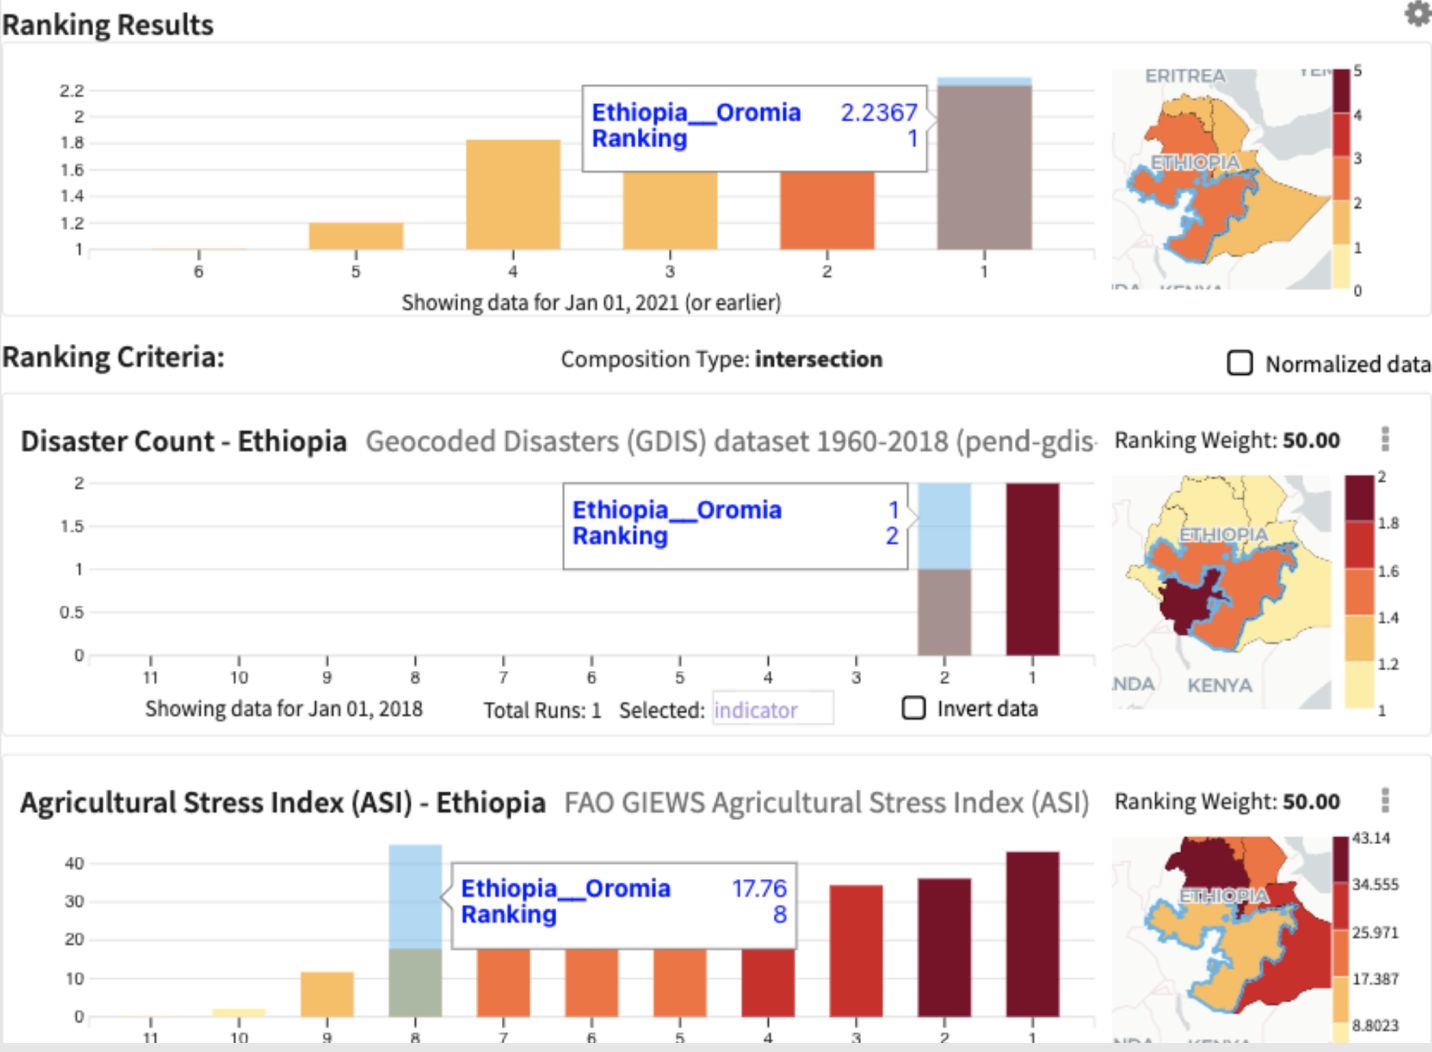
- Region Ranking: Find which regions are currently best/worst with respect to variable(s) of interest.