Causemos Human Machine Interface (HMI)
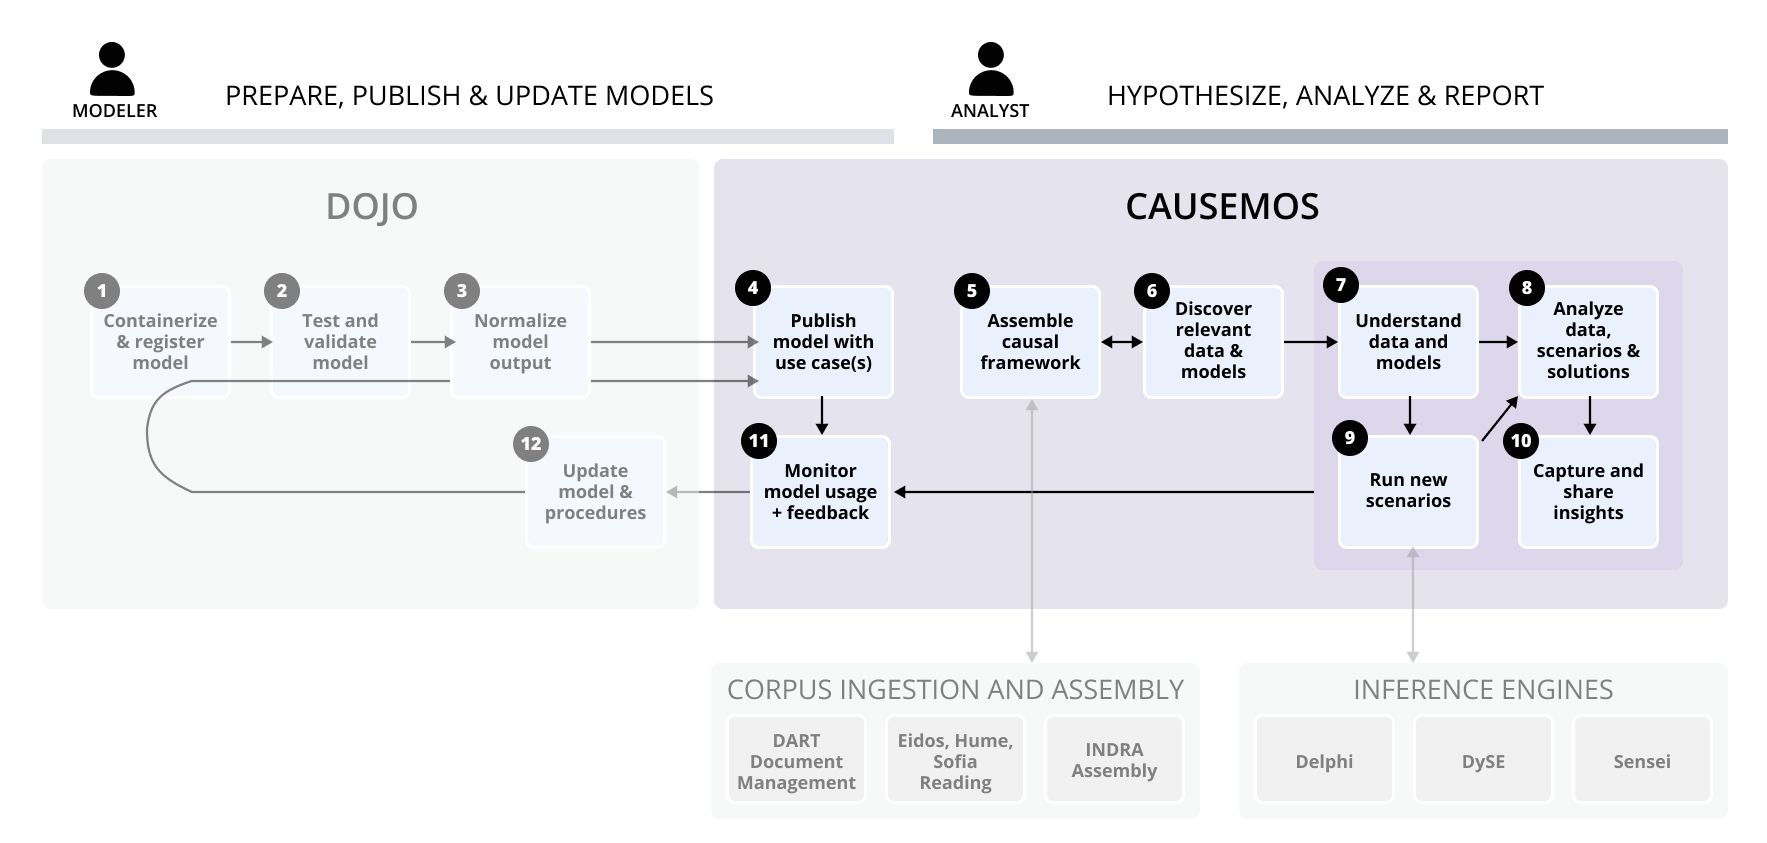
The analytic workflow example in the following sections illustrates the use of the different views and tools in the Causemos HMI. The goal of the analysis in this case is to estimate the population vulnerable to food insecurity.
Note: Analytic workflows are highly non-linear. Causemos supports many different workflow paths.
Capturing Target Variables and Key Drivers in Simple CAGs
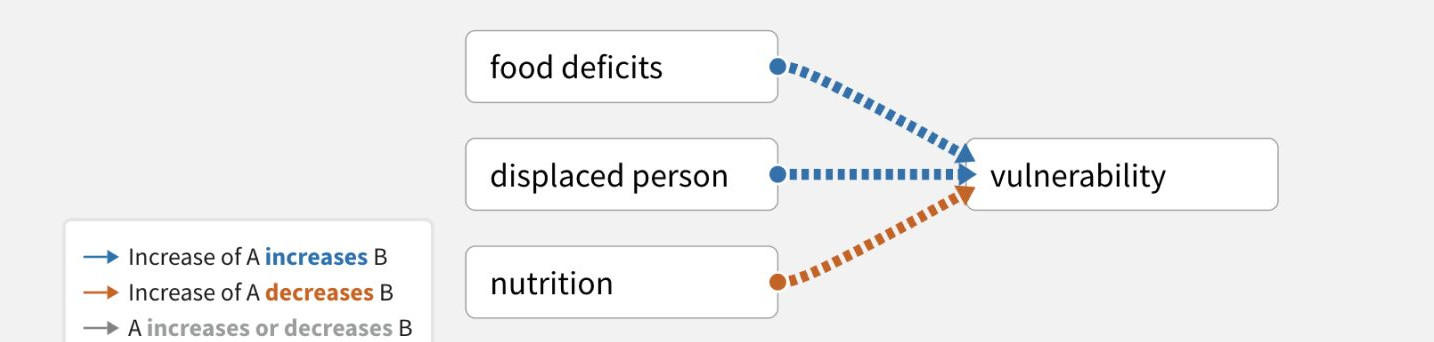
Causal analysis graphs (CAGs) help analysts define what they’re trying to understand or influence and determine how it can be measured. In building a simple CAG, analysts can capture the target variables and key drivers.
Food Insecurity Example
To begin estimating the population vulnerable to food insecurity, capture the key factors that lead to vulnerability, which include food deficits, poor nutrition, and displacement.
Combining Datacubes of Key Drivers to Rank Regions for the Target Variable
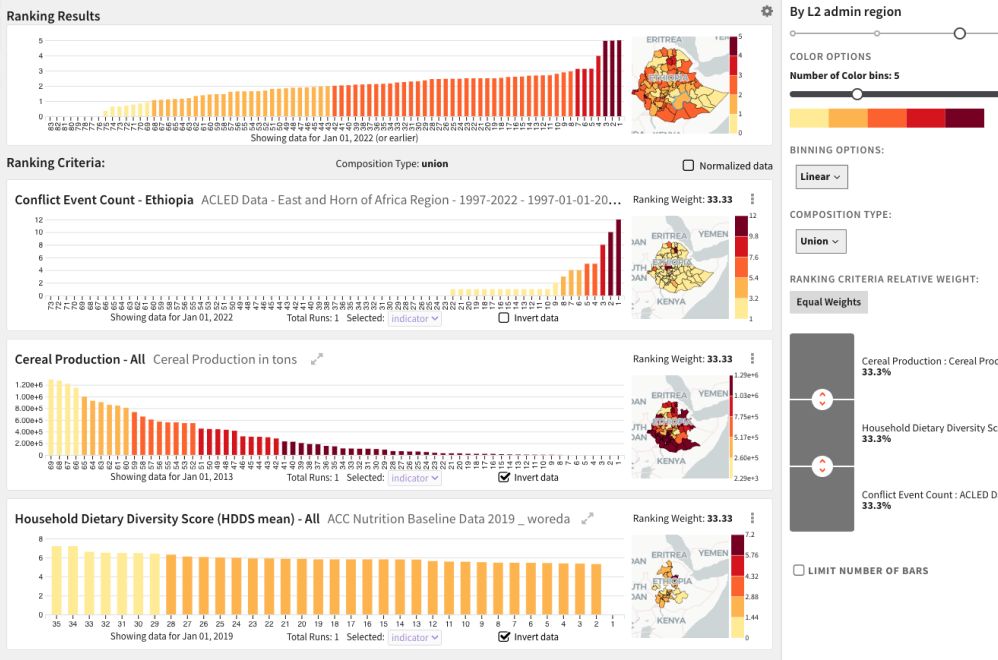
Datacubes are sets of data derived from expert model simulations or other structured datasets. They help analysts drill down on the factors in a CAG to understand where the issue is currently most prevalent based on the combination of its key drivers.
Food Insecurity Example
Combine the datacubes of the key drivers to get a region ranking for the number of vulnerable people based on weighted criteria that correspond to the factors in the CAG. Identify the weighted criteria by using the data explorer to find appropriate data proxies or by bringing outside data into the system.
Analyzing Driver Datacubes
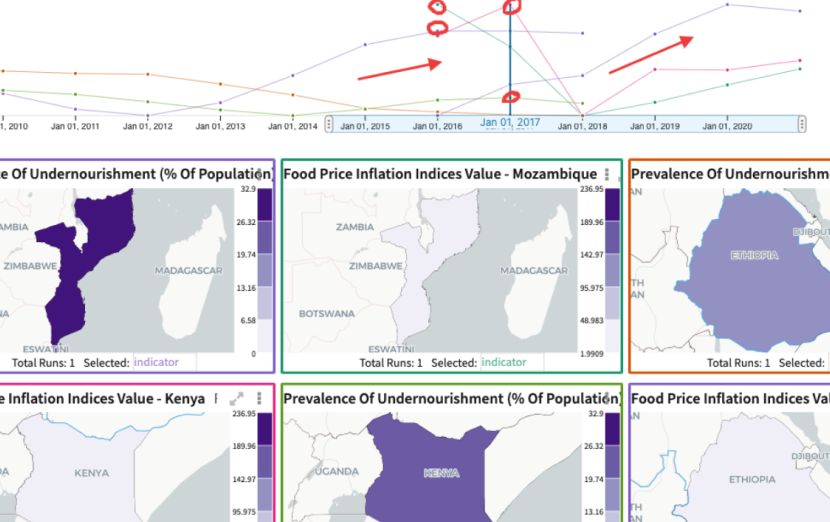
Further analysis of datacubes for the key drivers can help identify historical and regional analogs or current and potential future levels.
Food Insecurity Example
Looking at malnourishment over time, identify historical periods when it was particularly high. Since food availability did not follow the same pattern, hypothesize that food affordability may have restricted food diversity and caused malnourishment. By exploring available datacubes for food prices, see that spikes in food prices are usually correlated with spikes in malnourishment. Looking at neighboring countries with high food inflation also shows correlation with peaks in malnourishment.
Leveraging Integrated Knowledge to Augment CAGs
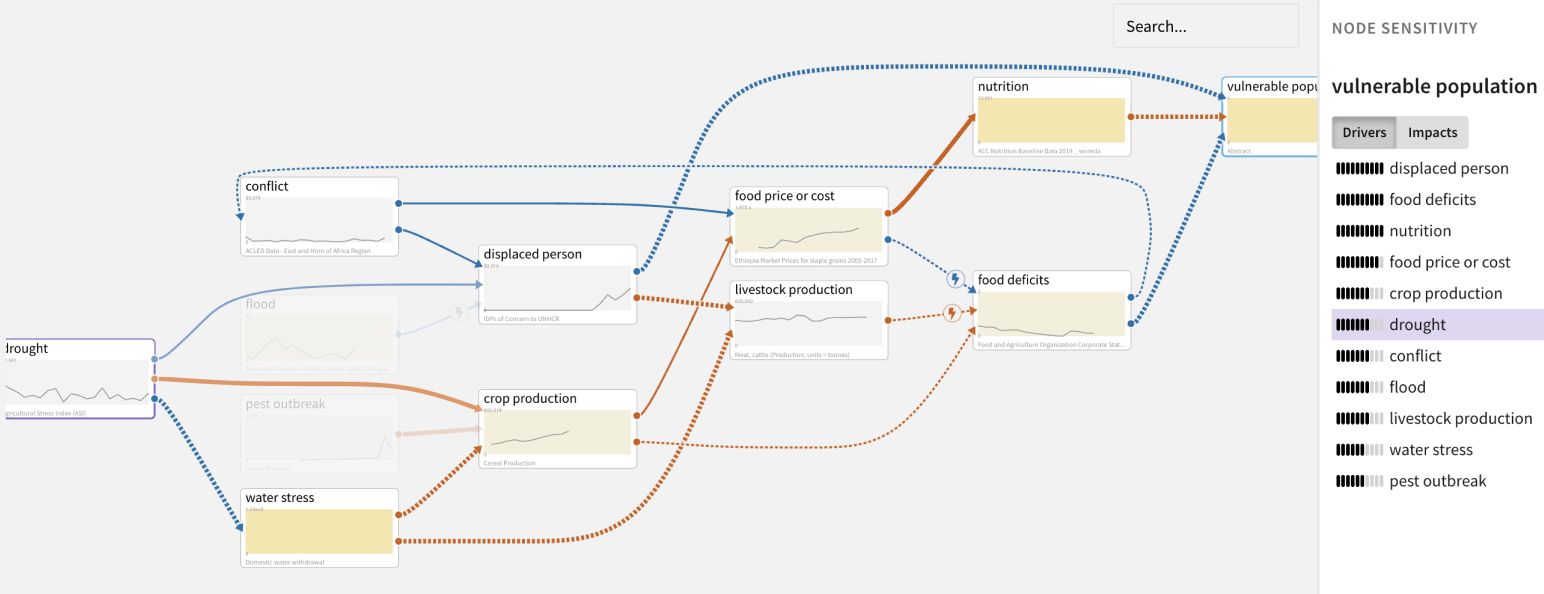
By leveraging integrated knowledge, analysts can augment a simple CAG to create more explanatory power. This can help identify the key dynamics of the system, explaining the root causes and impacts of the issue.
Food Insecurity Example
Add conflict as a driver of displacement and capture a reinforcing feedback loop between food deficits and conflict. Add crop production as a driver of food deficits and the interaction with climate shocks, food prices, and conflict. Apply sensitivity analysis to see that change in climate drivers has the most impact on the whole system. Explore the ranked pathways between each climate driver and vulnerability to better understand risk.
Comparing Baseline Risk Assessment with What-If Scenarios
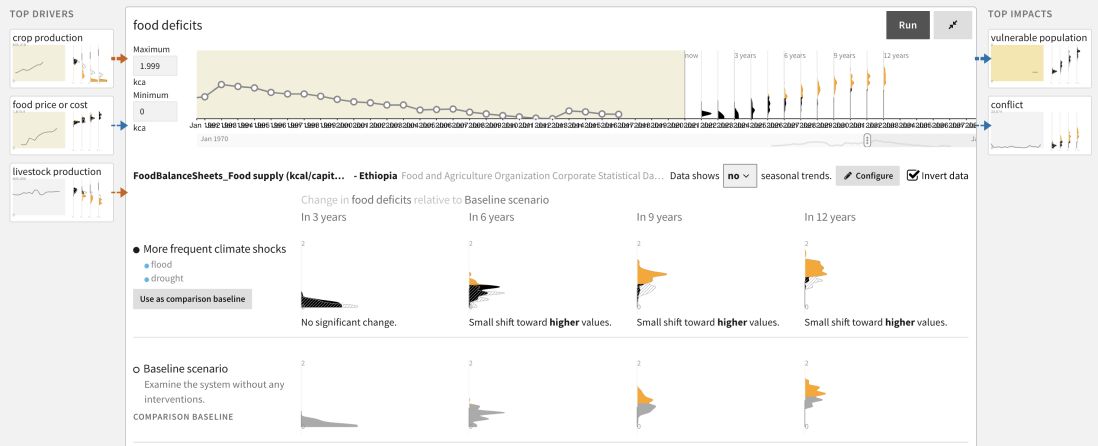
Using the CAG and domain models to compare baseline risk assessment with various “what-if” scenarios can help identify whether and why things will worsen, improve, or remain the same.
Food Insecurity Example
The direction of the baseline projections in the CAG suggest that conflict will keep pushing food prices higher, which will reduce food affordability. Despite stable food availability (assuming an average harvest), food deficits will worsen, which will fuel more conflict. Harmful climate scenarios (drought, flood) push crop production down and displacement up, which amplifies the baseline trends.
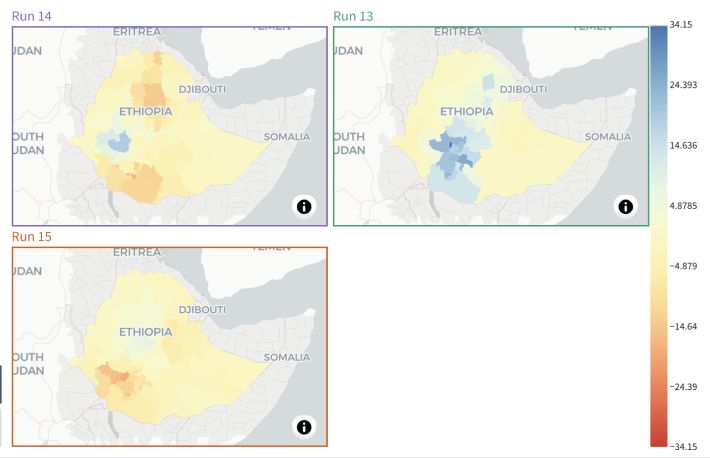
To understand which regions might be most affected by various scenarios in more detail, compare the impacts of different rainfall scenarios relative to the normal conditions in the DSSAT domain model available in Causemos. See that increasing fertilizer usage has diminishing returns but could mitigate the impacts of drought in some regions. Use the CHIRPS-GEFS model to get a climate forecast for the next three months and assess the likelihood of the explored climate scenarios.
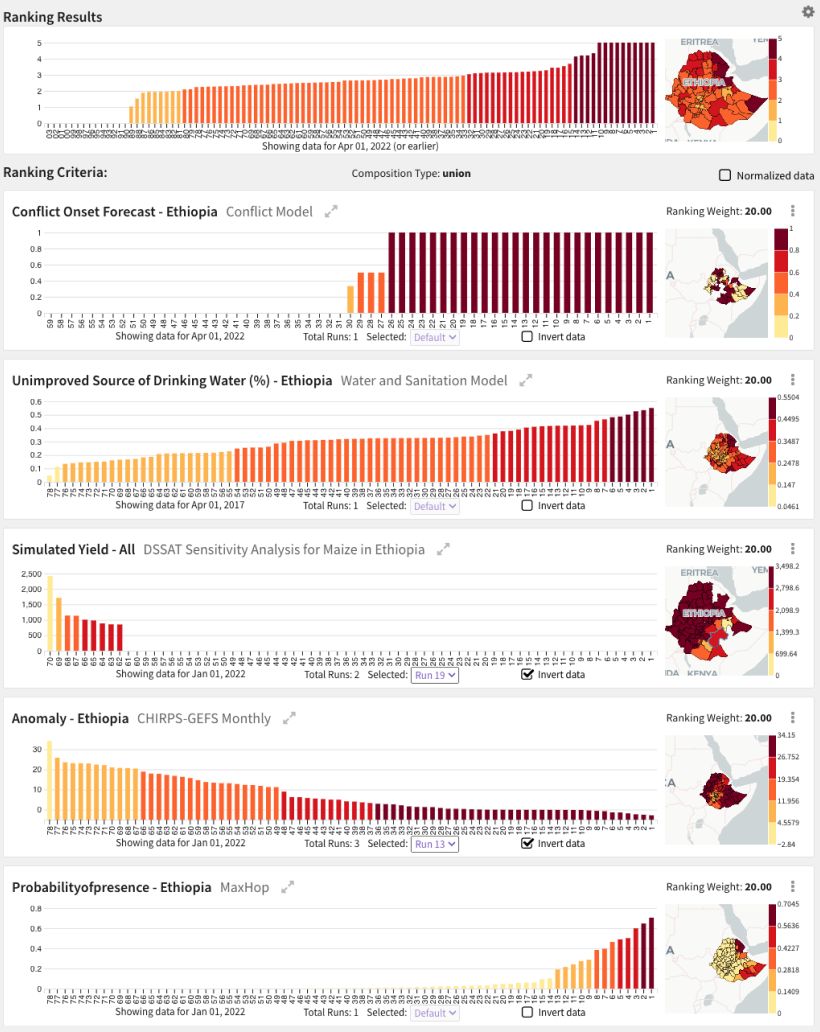
Combining Datacubes to Rank Project Impacts
Combine the datacubes used for forecasts, scenarios, and interventions to get region rankings of project impacts and understand where resources should be directed to target the issue.
Food Insecurity Example
Rank regions based on the size of vulnerable populations for projected climate risks in datacubes of domain models (e.g. for crop production, pest likelihood and market access). Compare the ranking with the addition of simulated interventions in those models.
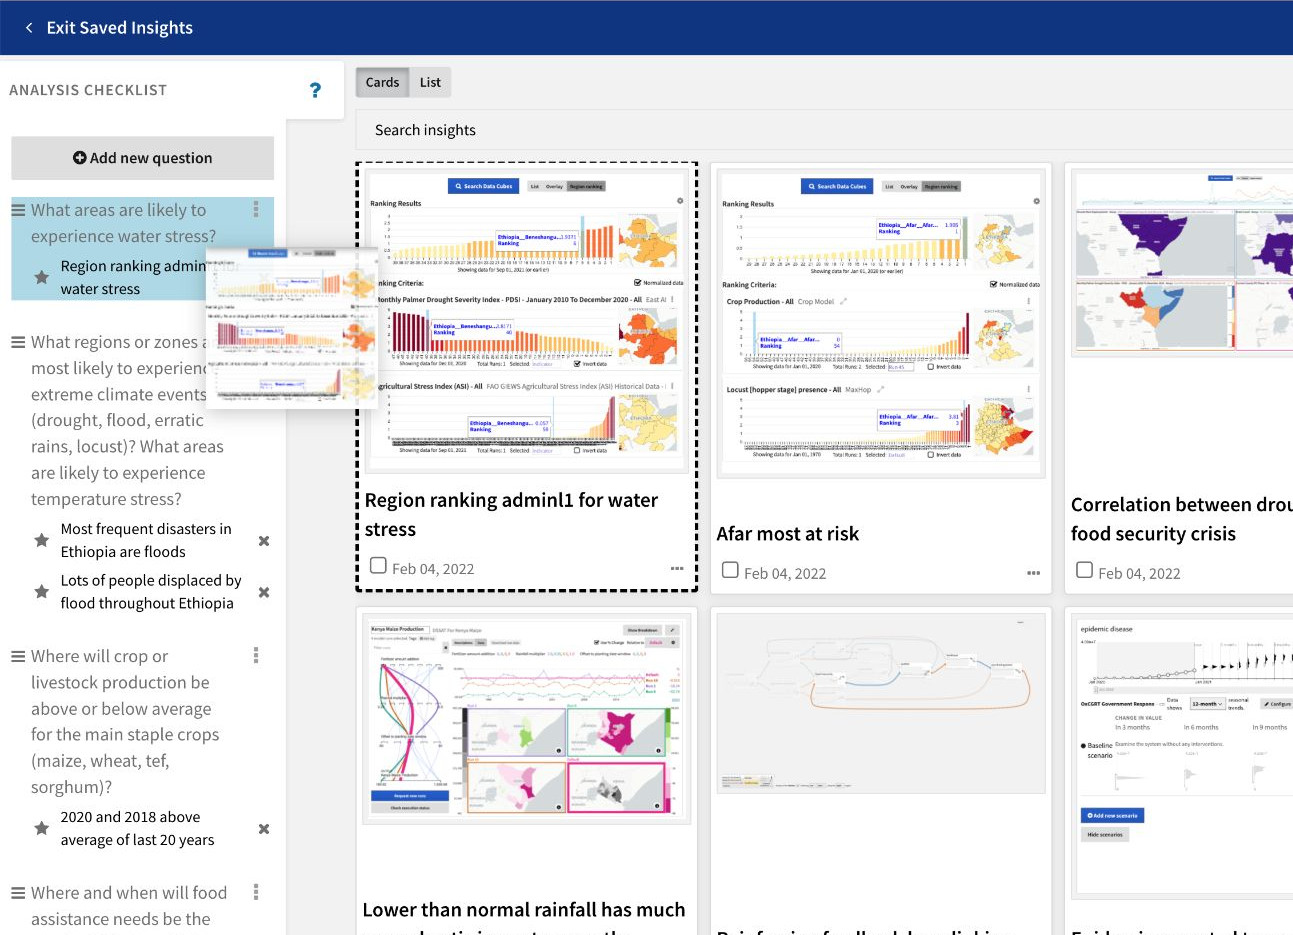
Insights
Causemos enables analysts to track and organize analytical processes as insights, which are saved use cases or checkpoints that can be restored. Insights can include meaningful analytical findings (big or small), bugs/issues to share with developers, or descriptions of what needs to be improved or done next.
Installation
More detailed Causemos installation can be found in https://github.com/uncharted-causemos/quickstart.
The following describes steps to install and run the Causemos application stack. This assumes the infrastructures and initial setups are in place.
- Clone
git@github.com:uncharted-causemos/quickstart.git - Go into app directory
- Change the configuration files under envs
- Run
docker-compose up - Causemos will be available on localhost:3003
For Causemos Infrastructure stack, and prep the initial data, you will need docker, ‘python, and a prefect` enabled environment.The full detail can be found here.