Skip to main content Link Search Menu Expand Document (external link)

Analysis Within Any Datacube

Causemos supports several types of quantitative analyses within a datacube, including:

  • Temporal trend analysis: Find the trends for a particular indicator over time. Use the Conflict Event Count timeline to determine whether conflict events are increasing over time.
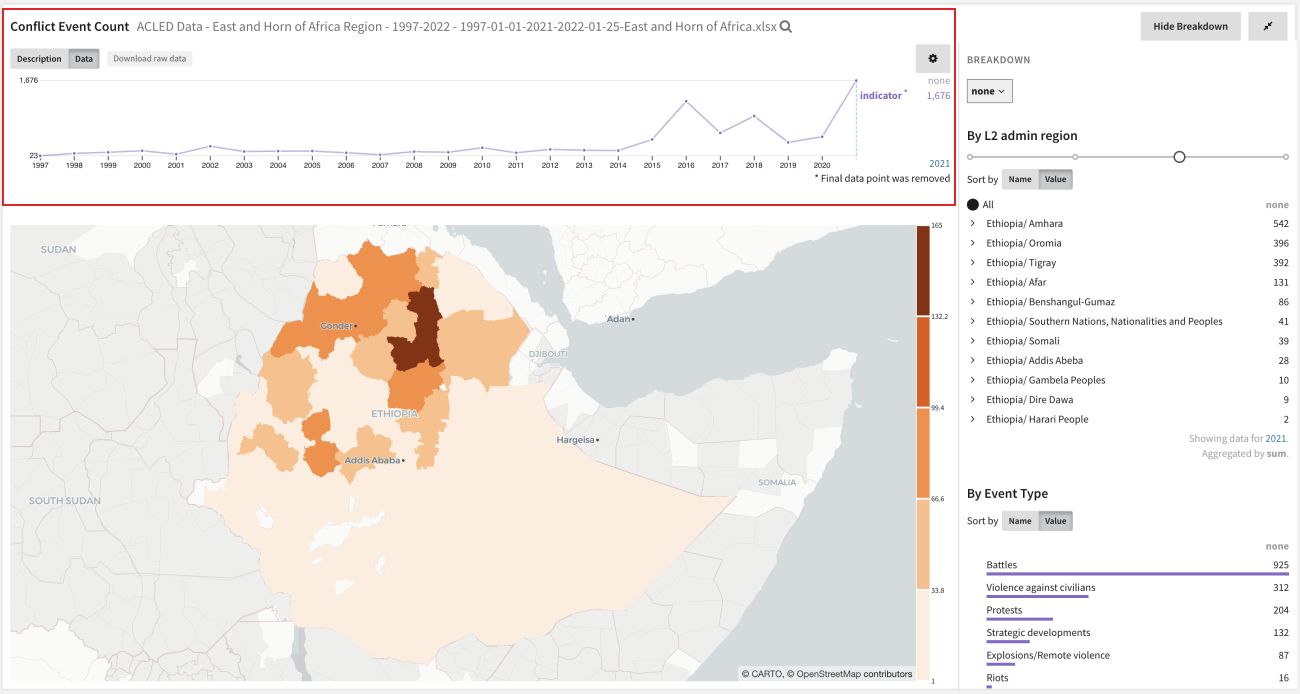
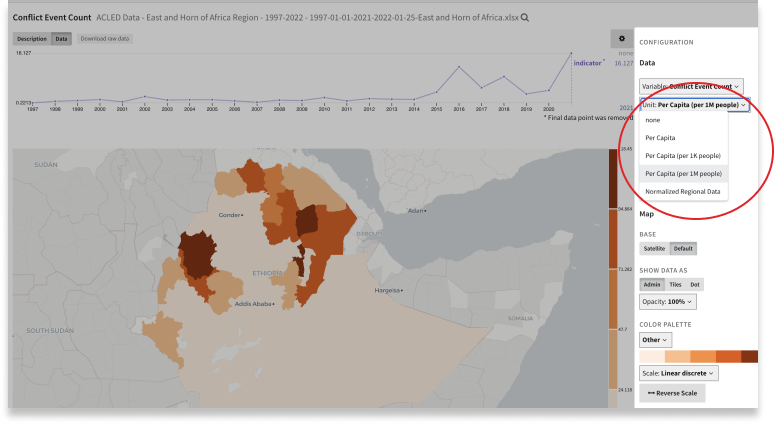
  • Spatial Analysis: Find the values of an indicator or indicator per capita at a particular time in various regions. See which regions had the most conflict events in 2021. To avoid reflecting the population density, change units to per 1M people to see which conflict is the worst in the West.
  • Split by Region - Comparative Analysis (Regional Analog, Regional Patterns): Find where an indicator was above/below some regional reference. Examine precipitation anomalies split by region to find that June and October were wetter than usual in the northern regions of the country.
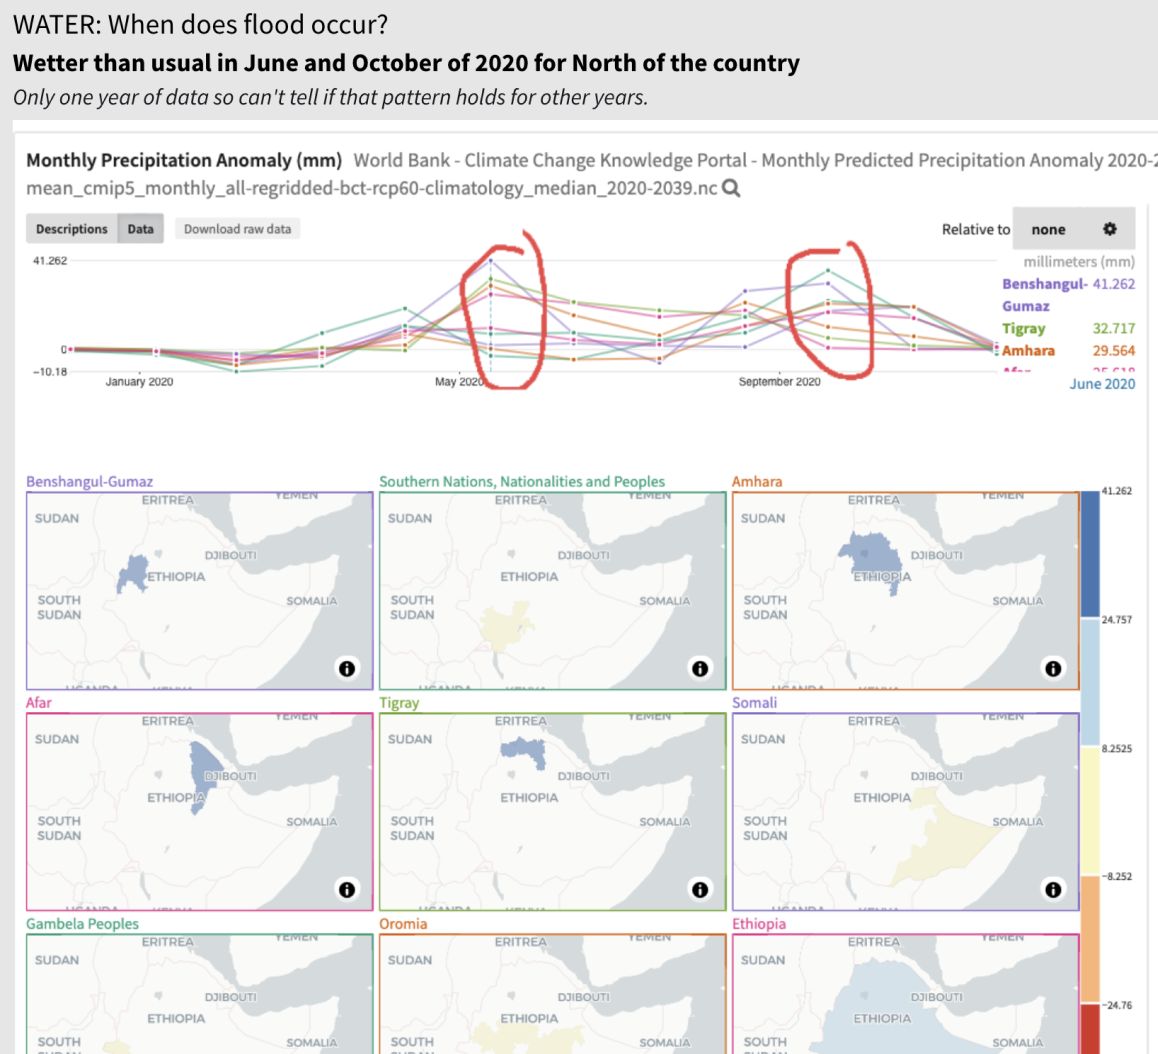
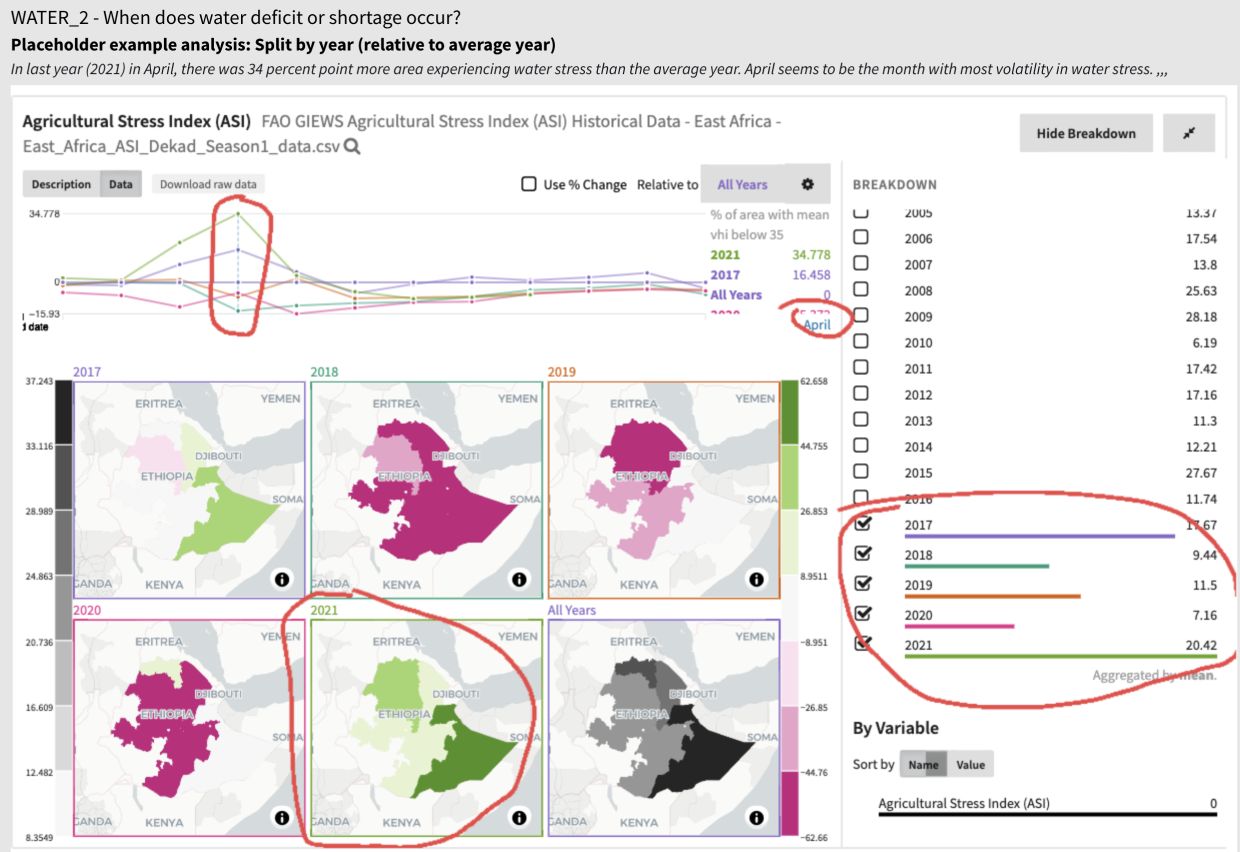
  • Split by Year - Comparative Analysis (Historical Analog, Seasonal Patterns): Find when a variable of interest was below/above a temporal reference and in which month a type of seasonal event most occurred. Top, compare agriculture stress for the last five years relative to the average of all years, revealing that the greatest variability was in April. Right, examine stacked years of monthly agricultural stress data.
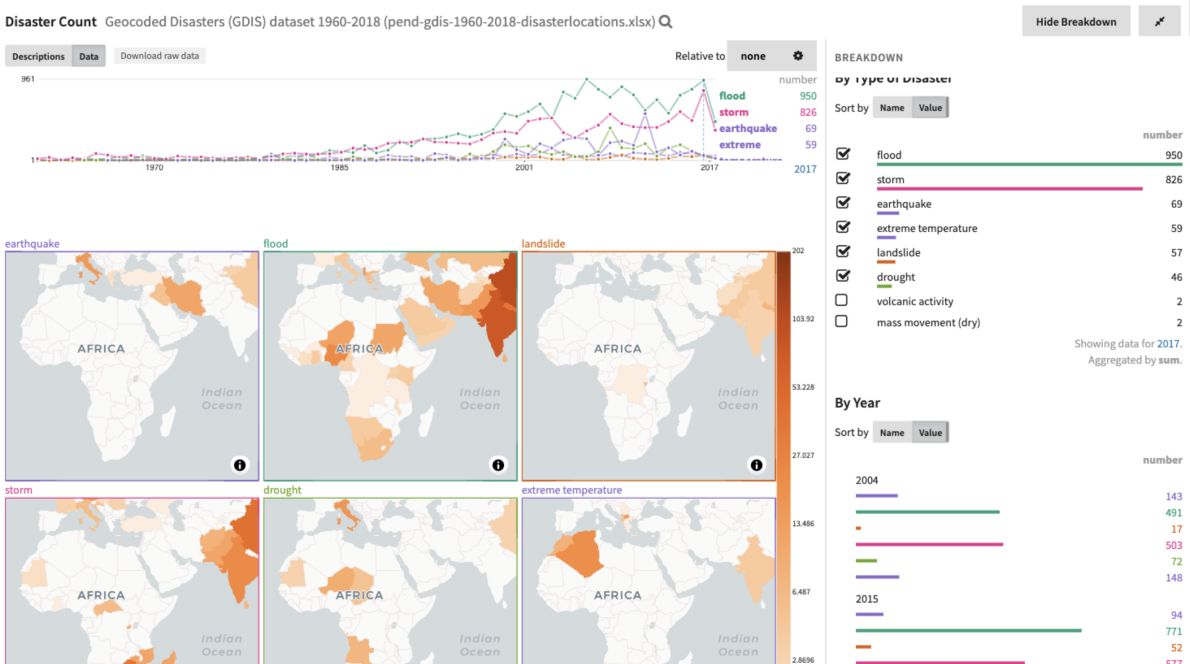
  • Split by Category: Find how categories/types of a variable are distributed in time and space. Examine the frequency of different types of natural disasters across time and space.