Data Registration
Contents
Getting started
The data registration workflow currently support registering 4 data types:
- CSV
- Excel
- NetCDF
- GeoTIFF
You may begin by navigating to dojo-modeling.com and selecting Data registration. Please reach out to dojo@jataware.com for credentials or help with the application. From there you will be asked for basic metadata about your dataset.
Please provide as much information as possible throughout the data registration process to ensure that sufficient information is available to end-users of your dataset.
Metadata capture
This form captures metadata about your data. There is a demonstration below, as well as definitions for each field:
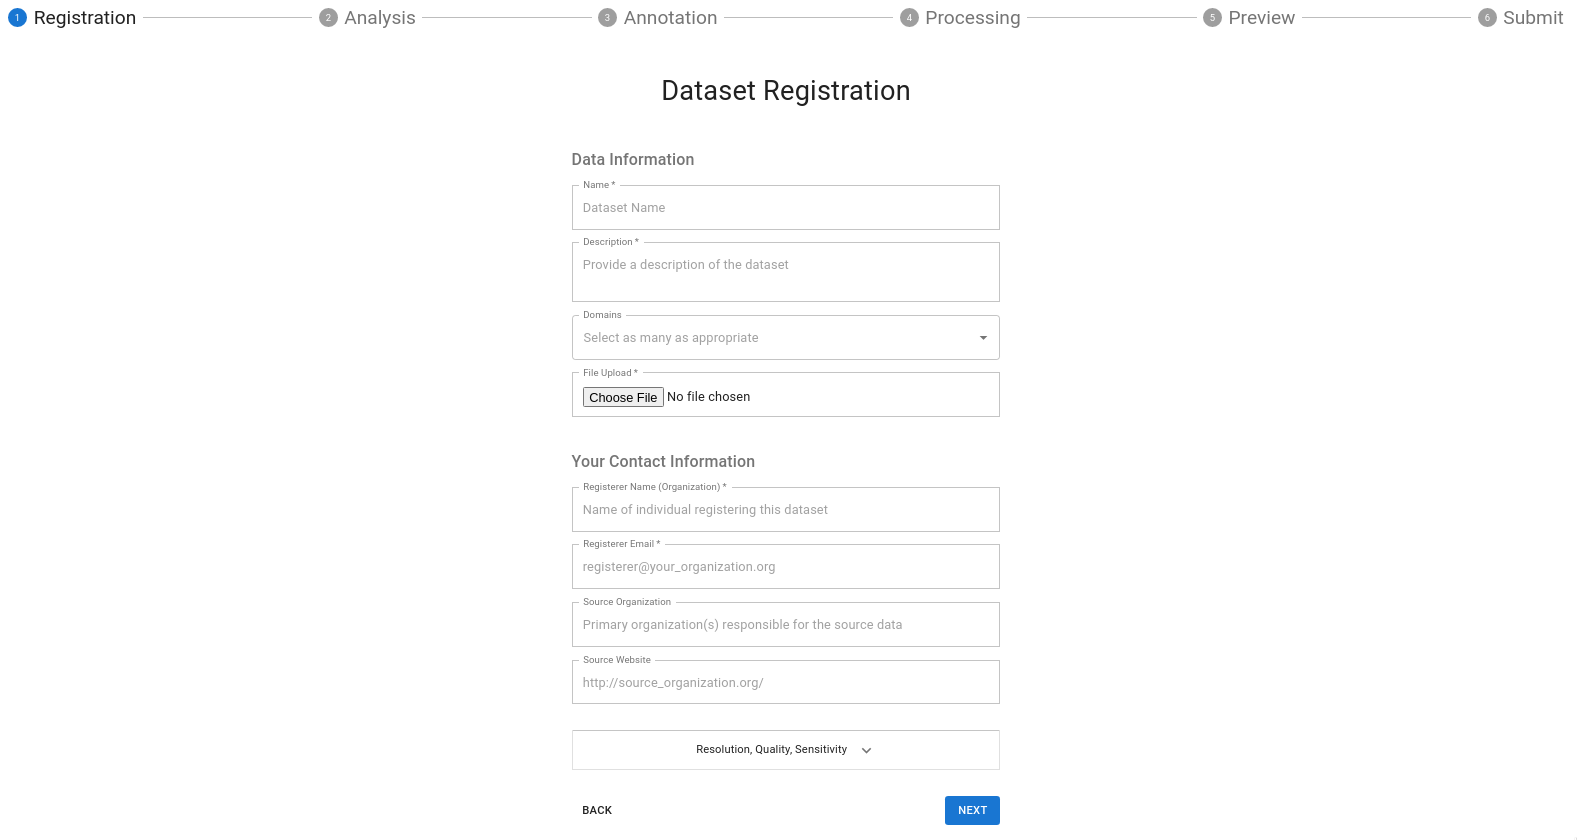
Model Overview Form Field Definitions:
Name: Name of the DatasetDescription: Your description here is the forward-facing documentation about your data that the end-user will see. Include as much information as possible to explain your data.Category: Add any over-arching categories that your data can be classified as; separate each category with a comma.Resolution:- Choose the applicable temporal resolution from the drop-down
- Enter the X and Y resolution of your spatial data
Maintainer Information:Name: The primary point of contact for the dataset.Email: The primary point of contact’s e-mail address. If you have one, a group e-mail is also acceptable.Organization: The organization that created the dataset.Website: This can be a link to your dataset’s repository or another website that you may maintain that provides additional context about your data.File: See preparing data for Dojo
Geo and time inference
Once you have uploaded your dataset, Dojo analyzes it to determine whether your dataset contains place or time information such as timestamps, latitude, longitude, ISO country codes, etc. This analysis process may take a few seconds, but it will ultimately speed up your data annotation.
Annotating your dataset
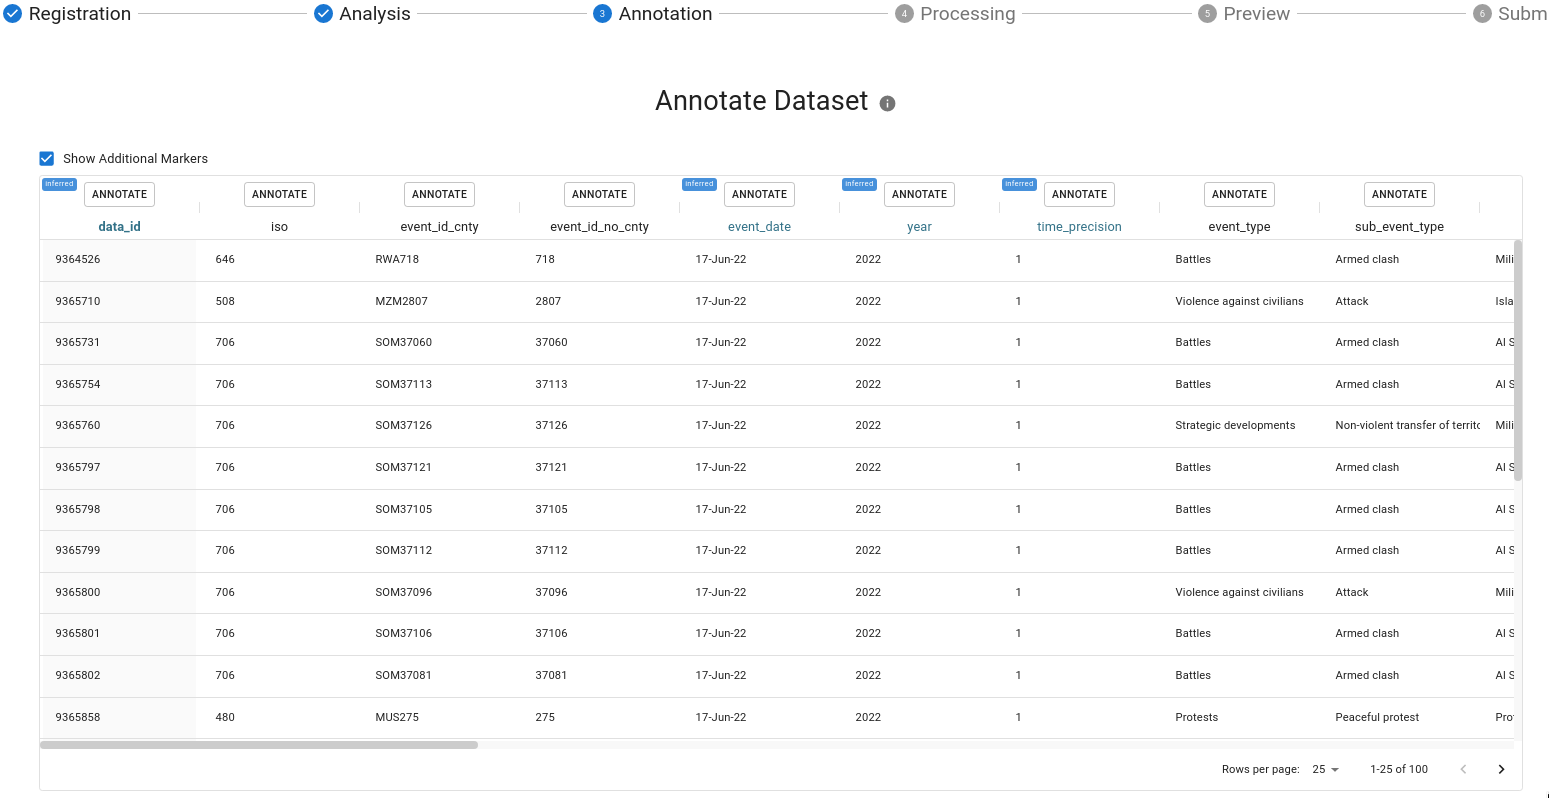
Next, you will be shown a sample of your dataset. Columns highlighted in blue represent those which had a detected time or location feature.
Click the Annotate button at the top of each column to annotate it.
Note: you should only annotate columns that you wish to retain in the final, transformed dataset.
Once you’ve annotated a column it will be highlighted in green.
You will be asked for a display name and description for your dataset. Additionally you will be asked whether this column is either Date, Geo, or a Feature.
In the case of Date and Geo columns, they may be set to primary. It is important to choose only one column to be the primary Date and one to be the primary Geo. In the case of a build a date or coordinate pairs all relevant columns will be associated as primary if the user sets that “grouping” to be primary.
Date formatting
In the below example, the user annotates the “Year” column.
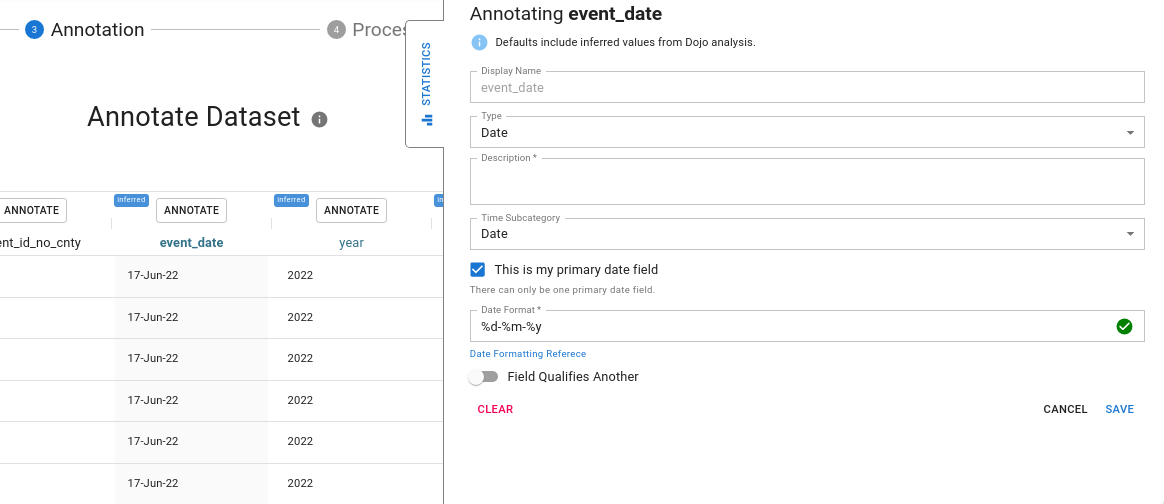
For date columns, the format is automatically detected Date formats are defined using the strftime reference. Please refer to it for questions about how to correct or update the date format for a column. Generally, our column analysis process can correctly assign a date format, but periodically the user must update or correct this with an appropriate formatter. For example 2020-02-01 would have the date format %Y-%m-%d but Februrary 1, 2020 would be %B %-d, %Y.
If the date formatter is incorrect the column preview will turn red until the user has corrected it.
Build a date
Some datasets have year, month and day split out into separate columns. In this case, the user may “build a date” by annotating any of the relevant fields and indicating that it is part of a multi-column datetime object.
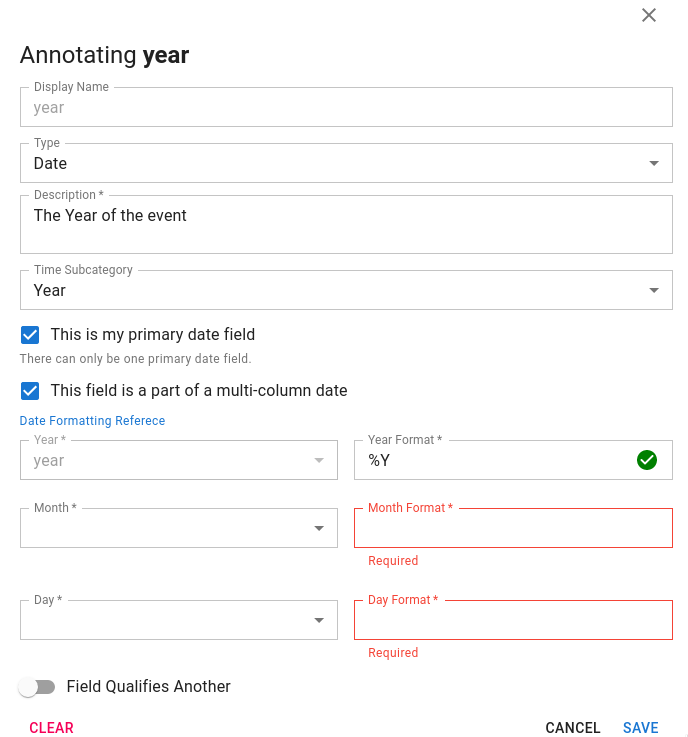
The user can then select the relevant year, month and day columns as well as ensure they have correct date formatters.
Coordinate pairs
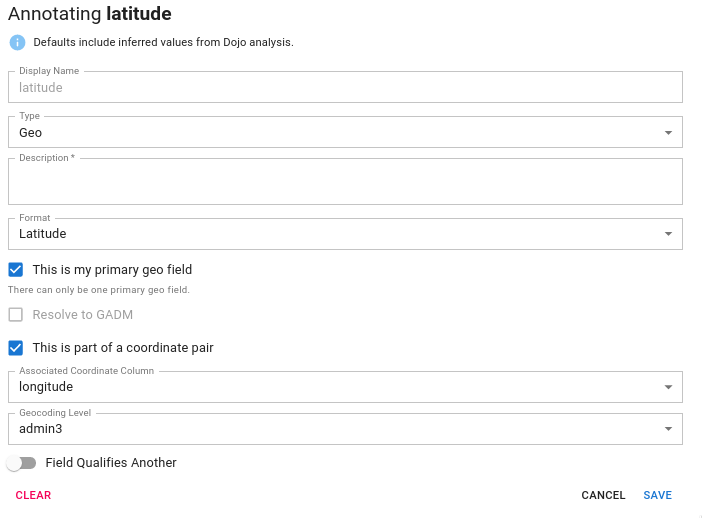
Generally speaking, if a dataset has latitude and longitude in it we should annotate this and ignore the other geospatial information (unless they are qualifiers) as this is the most granular location information available and can be used to geocode the remainder of the dataset.
However, latitude and longitude are not typically contained in the same column. So, we provide a mechanism for the user to associate a latitude with a longitude and vice versa. To do this, you indicate that the column is part of a coordinate pair and choose it’s partner from the dropdown.
Multi-part geographies
If a dataset has geographies that correspond to country, admin1, admin2, and admin3, these should be added without flagging as primary_geo.
If any of these are flagged as
primary_geo, then the remaining geographies will be added asfeatures.
For example, if the dataset includes:
| ADMIN0 | ADMIN1 | ADMIN2 |
|---|---|---|
| Djibouti | Dikhi | Yoboki |
| Djibouti | Obock | Obock |
and the following assignments are made:
- ADMIN0 Type:
GeoFormat:CountryThis is my primary geo field - ADMIN1 Type:
GeoFormat:State/Territory - ADMIN2 Type:
GeoFormat:Country/District
the Preview will display results similar to:
| country | admin1 | admin2 | feature | value |
|---|---|---|---|---|
| Djibouti | NAN | NAN | ADMIN2 | Yoboki |
| Djibouti | NAN | NAN | ADMIN1 | Obock |
if instead the following assignments are made where no field is marked primary_geo:
- ADMIN0 Type:
GeoFormat:Country - ADMIN1 Type:
GeoFormat:State/Territory - ADMIN2 Type:
GeoFormat:Country/District
the Preview will display results similar to:
| country | admin1 | admin2 |
|---|---|---|
| Djibouti | Dikhi | Yoboki |
| Djibouti | Obock | Obock |
Qualifiers
Many datasets contain features that qualify other features. For example, in a conflict/event dataset such as ACLED, you may have a category for the type of event. The primary feature associated with the event may be number of fatalities, while the category “qualifies” the number of fatalities.
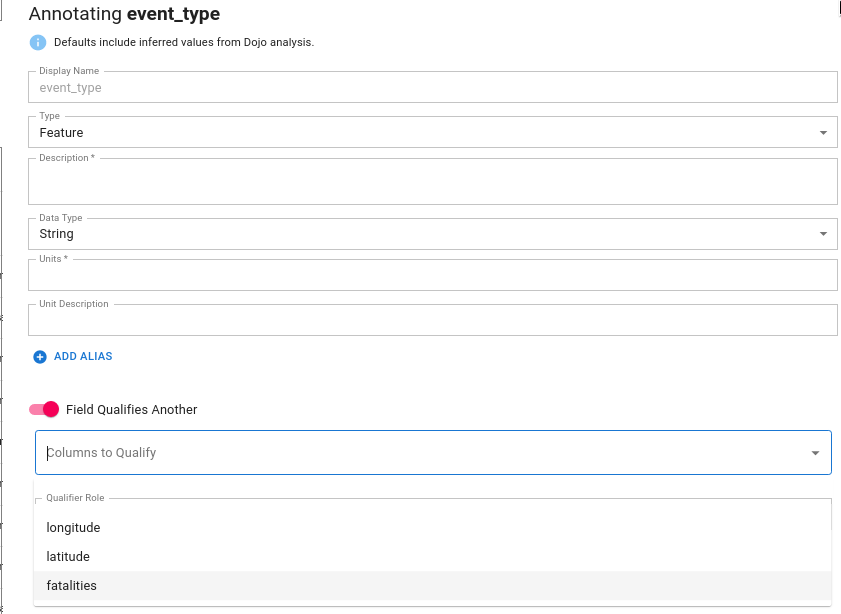
To set Event Type as a qualifier for fatalities the user should check the box indicating that this field qualifies another. The user should then select the relevant columns that the current feature qualifies. One field may qualify many features; in this case select all relevant features that the field of interest qualifies.
Note: you should only qualify other features, not
GeoorDateinformation since those are inherently dataset qualifiers. This avoids “qualifying a qualifier.”
Feature Statistics
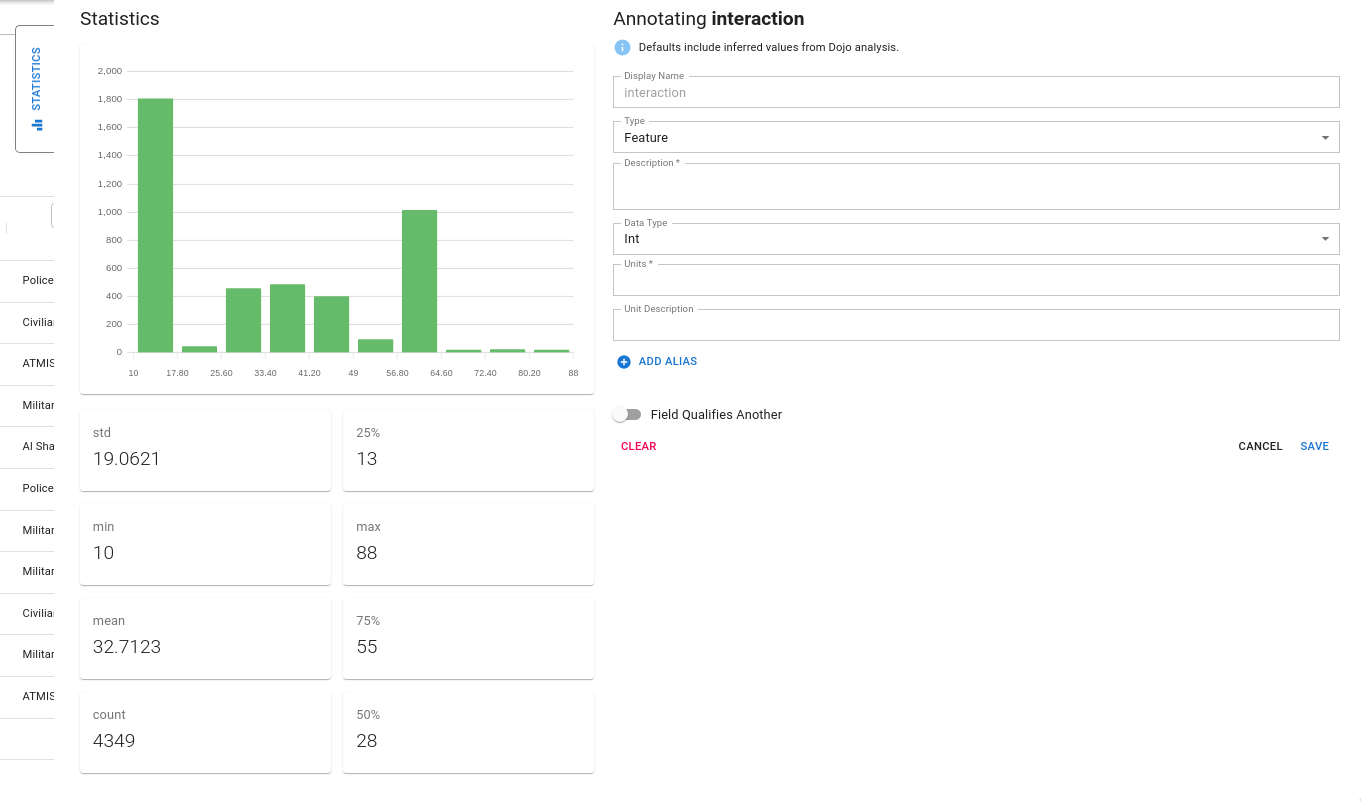
The feature annotation component includes a statistics tab. When expanded, this tab provides a variety of descriptive statistics about the feature including:
- the distribution of the feature (via a histogram)
- count
- min, median, max as well as percentiles
- for string features, the mode is provided
These statistics are intended to provide the user the ability to perform quality checks of the data they are annotating.
Transforming the dataset
When you have completed annotating your dataset you should have at least one feature annotated as well as a primary geography and date. If no primary Date or Geo information was provided, we do our best to identify what might have been primary based on the user’s annotations.
We then transform the dataset into a ready-to-use format. This process may take some time, depending on what is required. If the dataset is quite large and requires reverse geocoding latitude and longitudes into admin 0 through 3 (using GADM) it could take up to a few minutes.
After the dataset has been transformed a preview will be shown in the ready-to-use format. If the dataset is large, a random sample of 100 rows is taken to allow the user to spot check accuracy. All features are “stacked” on top of each other. Qualifiers are added as additional columns to the right.
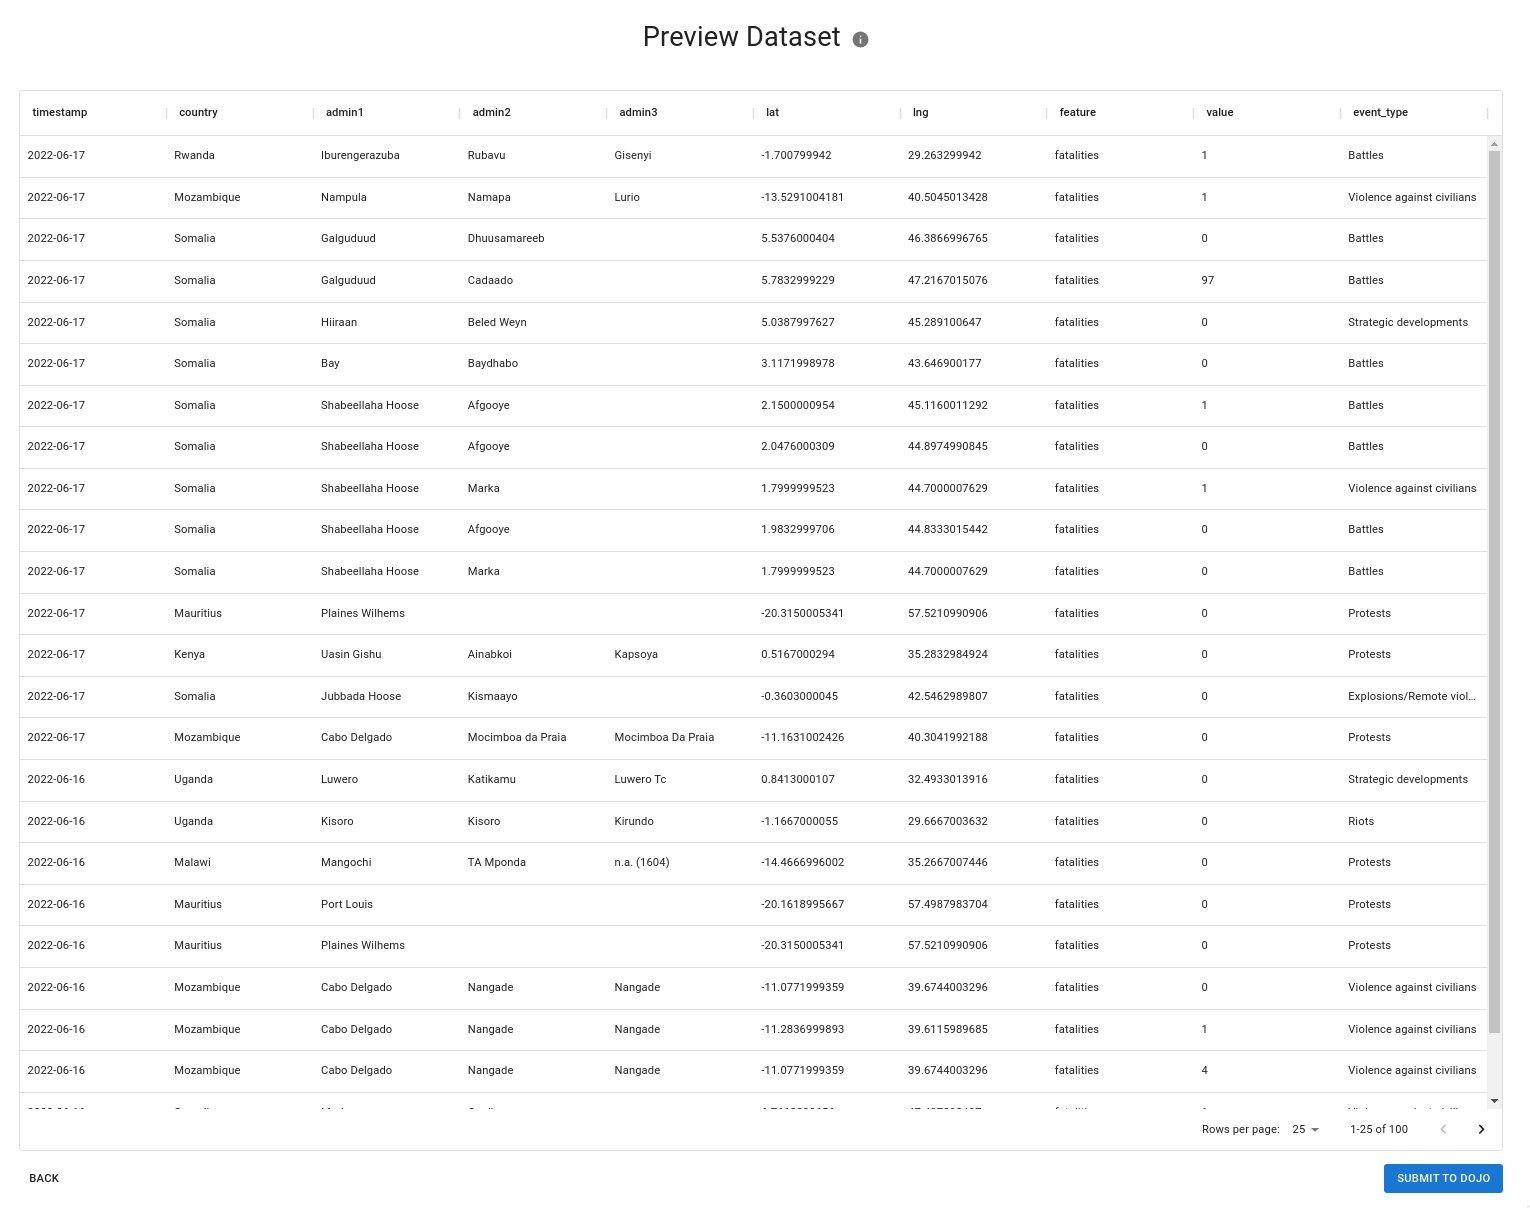
During this step, we attempt to automatically normalize all place names to the GADM standard. If your dataset contained columns for things like country, admin 1, ISO codes, etc we perform entity resolution behind-the-scenes to ensure that the place name spelling matches GADM. This ensures consistent place naming for downstream data consumers.
If everything looks good the user can download this table if they wish. To save their work, the user must Submit to Dojo. Upon success the user can register another dataset or view the final metadata in Dojo.